Monitoring with SigNoz
Finding good reasoning to explore different options for monitoring or better [observability] is difficult. Either there wasn’t the singular impact on production yet, that made you lust for better monitoring and/or it is difficult to understand the merit and invest of time.
And even when you make the decision to dive into it, it is always a good idea not to start on production, but with a simple example. Simple examples on the other hand rarely show the real powers, so it usually ends in heavily contrived ones like the one I’ve used in my last post about Logging vs Tracing.
Still, nobody got fired for buying IBM ramping up monitoring, so let us - for the course of this post - put our EFK stack and friends aside and get started with something shiny new in Golang.
What is SigNoz? &
If you are like me and you haven’t heard the name SigNoz before the first and foremost
questions are probably what is SigNoz and why not one of these solutions
insert random product here.
From a marketing perspective the key selling point for me probably and honestly was the headline on the frontpage:
OpenTelemetry-Native Logs, Metrics and Traces in a single pane
Without knowing prior to that, this was exactly what I need, so well done marketing:
-
Seems to be FOSS
-
Single solution to address the three pillars
-
Nice and complete package
That sounds rather too good, but time to put on my wizard hat and to check the brief. Before messing with Docker, I checked the documentation and discovered an architecture overview and this looks like they hold their part of the bargain:
| 1 | Apps can directly send data to SigNoz |
| 2 | Otel collectors can transmit data as well |
| 3 | Internally another custom collector provides the endpoints to receive data |
| 4 | Though I haven’t heared of Clickhouse either before, but columnar storage sounds about right |
| 5 | Some abstraction to query the actual data |
| 6 | Alert Manager keeps tracks and handles all the various alerts - glad they haven’t reinvented the wheel |
| 7 | And the shiny bit we’ve spoken of before |
Collecting data &
Once Signoz is running, which basically boils down to calling docker-compose, a nice starter question is how to deliver your actual data to it.
OpenTelemetry is the defacto standard for that and offers many ways to gather, collect and transmit data via highly configurable pipelines. The only noteworthy thing here to pay attention to the size of the generated logs - which may cause some headaches as it did for me during my vacation.
While playing with SigNoz I discovered it doesn’t connect each of its containers separately to an OpenTelemetry Collector.[1], but passes this task entirely to a container with logspout.
After a quick glance at the Github page marketing did its thing again:
Logspout is a log router for Docker containers that runs inside Docker. It attaches to all containers on a host, then routes their logs wherever you want. It also has an extensible module system.
Alright, this still sounds like a splendid idea and is exactly we do in the example. In fact, there isn’t much we have to configure at all:
-
Docker needs a minimal config to get us started:
  logspout:
    container_name: todo-logspout
    image: "docker.io/gliderlabs/logspout:latest"
    pull_policy: if_not_present
    volumes: (1)
      - /etc/hostname:/etc/host_hostname:ro
      - /var/run/docker.sock:/var/run/docker.sock
    command: syslog+tcp://otelcol:2255 (2)
    depends_on:
      - otelcol
    restart: on-failure
1 Logspout needs access to the Docker socket and hostmapping for convenience 2 This configures a connection to a receiver of our otelcol instance and comes up next -
And we have to define a receiver in otelcol:
receivers:
  tcplog/docker:
    listen_address: "0.0.0.0:2255"
    operators: (1)
      - type: regex_parser (2)
        regex: '^<([0-9]+)>[0-9]+ (?P<timestamp>[0-9]{4}-[0-9]{2}-[0-9]{2}T[0-9]{2}:[0-9]{2}:[0-9]{2}(\.[0-9]+)?([zZ]|([\+-])([01]\d|2[0-3]):?([0-5]\d)?)?) (?P<container_id>\S+) (?P<container_name>\S+) [0-9]+ - -( (?P<body>.*))?'
        timestamp:
          parse_from: attributes.timestamp
          layout: '%Y-%m-%dT%H:%M:%S.%LZ'
      - type: move (3)
        from: attributes["body"]
        to: body
      - type: remove
        field: attributes.timestamp
      - type: filter (4)
        id: logs_filter
        expr: 'attributes.container_name matches "^todo-(postgres|otelcol|logspout)"'
      - type: json_parser
        parse_form: body
1 Operators allow to parse, modify and filter entries 2 This is the default format of the messages logspout forwards to otelcol 3 We basically move our content to the actual body of the entry 4 There might be lots of different containers running, so we limit the entries based on container names
Pillars in practice &
There is plenty of explanation and definition out there, way better than I can ever provide, but just to recall the three back to our memory:
Logging |
Historical records of system events and errors |
|---|---|
Tracing |
Visualization of requests flowing through (distributed) systems |
Metrics |
Numerical data like e.g. performance, response time, memory consumption |
Logging &
The first pillar is probably the easiest and there is also lots of help and reasoning out there, including this blog.
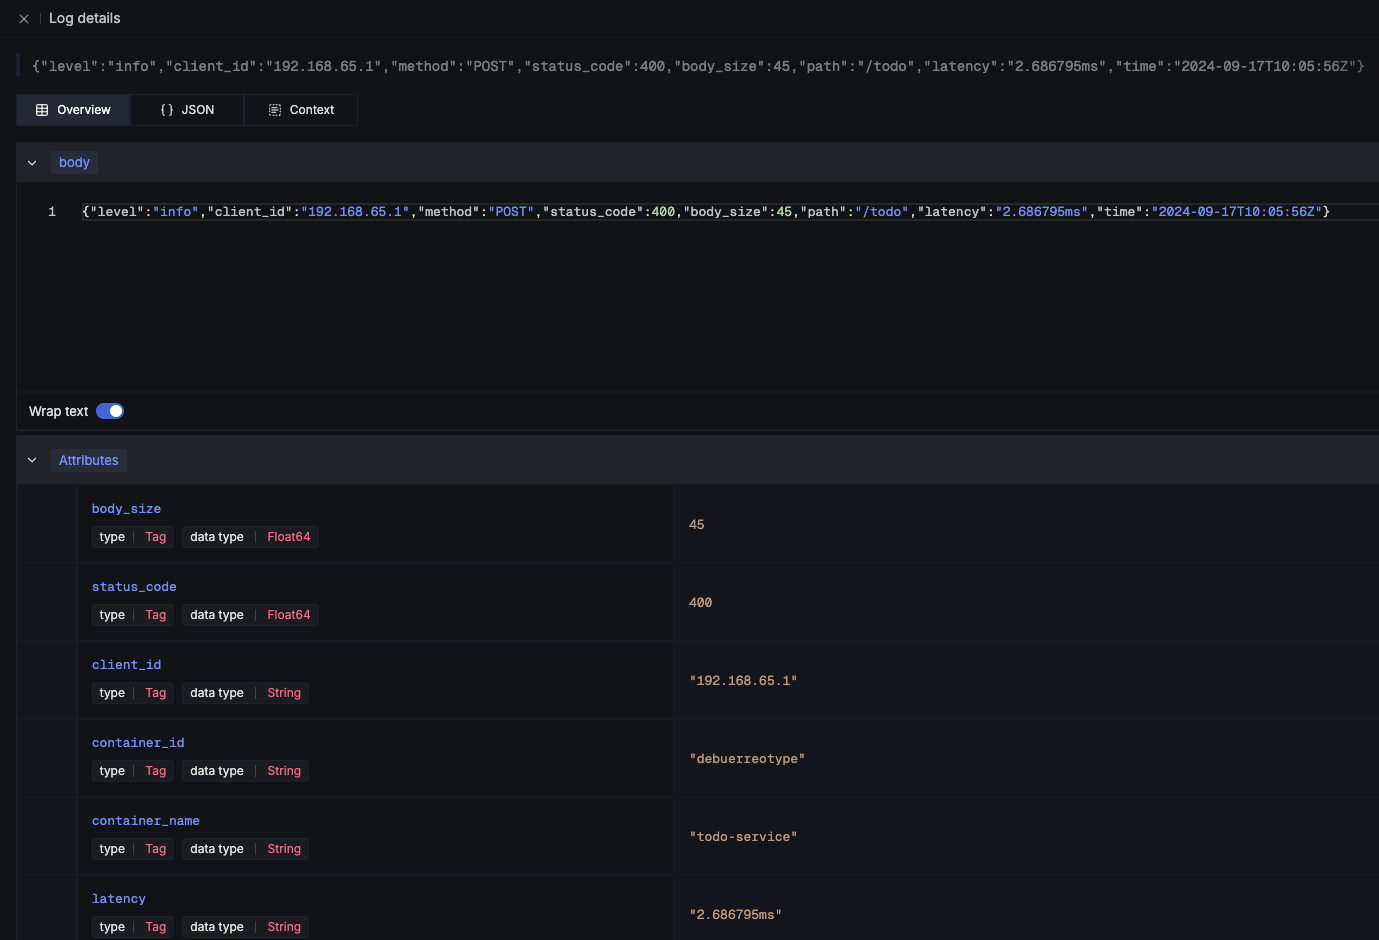
So best we can do is throw in zerolog, add some handling in a Gin-gonic middleware and move on:
logEvent.Str("client_id", param.ClientIP). (1)
    Str("correlation_id", correlationId). (2)
    Str("method", param.Method).
    Int("status_code", param.StatusCode).
    Int("body_size", param.BodySize).
    Str("path", param.Path).
    Str("latency", param.Latency.String()).
Msg(param.ErrorMessage)| 1 | The essential mapping magic happens here |
| 2 | A correlation id can help to aggregate log messages of the same origin |
SigNoz offers lots of different options to search data and if you have any experience with Kibana and the likes you will probably feel right away at home:
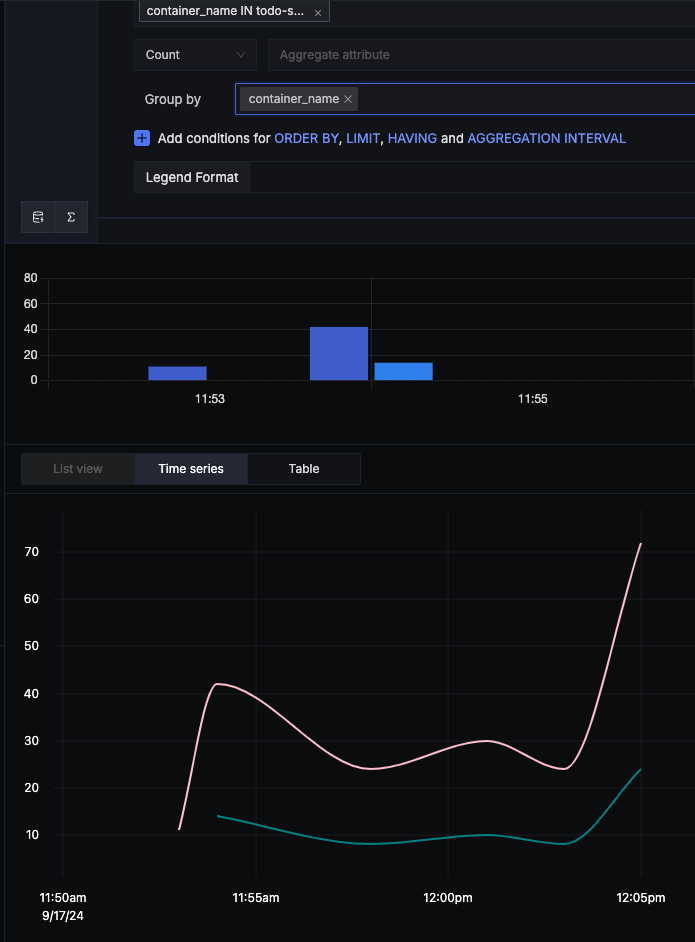
There is also no reason to shy away if you require some kind of aggregation and diagrams with fancy bars:
Tracing &
The second pillar is a slightly different beast and requires special code to enhance and propagate a trace - this is generally called instrumentation.
OpenTelemetry provides the required toolkit to start a tracer and also add spans:
func (resource *TodoResource) createTodo(context *gin.Context) {
    tracer := otel.GetTracerProvider().Tracer("todo-resource") (1)
    ctx, span := tracer.Start(context.Request.Context(), "create-todo",
        trace.WithSpanKind(trace.SpanKindServer))
    defer span.End()

    var todo domain.Todo

    if nil == context.Bind(&todo) {
        var err error

        // Fetch id
        todo.UUID, err = resource.idService.GetId(ctx)

        if nil != err {
            context.JSON(http.StatusBadRequest, gin.H{"error": err.Error()})

            span.SetStatus(http.StatusBadRequest, "UUID failed") (2)
            span.RecordError(err) (3)

            return
        }

        // Create todo
        if err = resource.todoService.CreateTodo(ctx, &todo); nil != err {
            context.JSON(http.StatusBadRequest, gin.H{"error": err.Error()})

            return
        }
    } else {
        context.JSON(http.StatusBadRequest, "Invalid request payload")

        return
    }

    span.SetStatus(http.StatusCreated, "Todo created")
    span.SetAttributes(attribute.Int("id", todo.ID), attribute.String("uuid", todo.UUID)) (4)

    context.JSON(http.StatusCreated, todo)
}| 1 | This creates a tracer based on the current context |
| 2 | Spans as working unit of a trace can include a status |
| 3 | Error messages can also be thrown in |
| 4 | And they can also include different types of general span attributes |
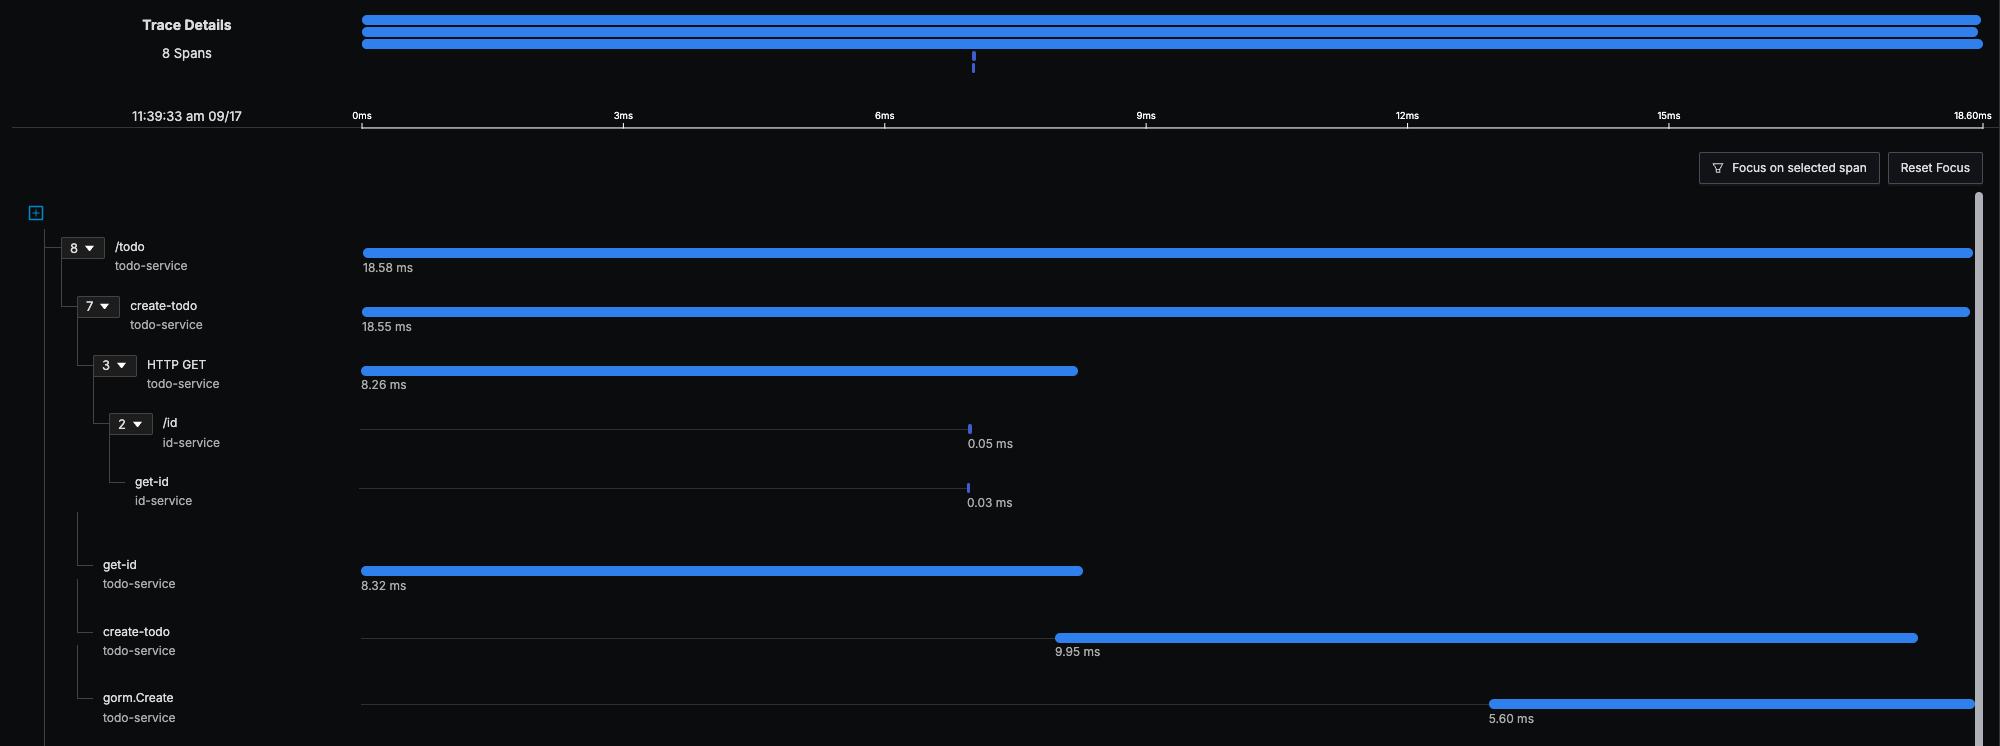
The above code calls the id-service and demonstrates how traces can be continued and passed
between service boundaries:
func (service *IdService) GetId(ctx context.Context) (string, error) {
    tracer := otel.GetTracerProvider().Tracer("todo-service")
    _, span := tracer.Start(ctx, "get-id")
    defer span.End()

    response, err := otelhttp.Get(ctx, fmt.Sprintf("http://%s/id",
        utils.GetEnvOrDefault("APP_ID_HOST_PORT", "localhost:8081"))) (1)

    if err != nil {
        return "", err
    }

    jsonBytes, _ := io.ReadAll(response.Body)

    var reply IdServiceReply

    err = json.Unmarshal(jsonBytes, &reply)

    if err != nil {
        return "", err
    }

    return reply.UUID, nil
}| 1 | The otelhttp package makes it really easy to propagate traces |
When everything is set up correctly propagated traces look like this:
Metrics &
The last pillar is one of the most interesting and probably the most troublesome, since there is no easy recipe what could and what should be done.
Metrics can generally be of following types:
Counter |
A simple monotonically increasing counter which can be reset |
|---|---|
Gauge |
A single value that can go arbitrarily up and down |
Histogram |
A time series of counter values and a sum |
Summary |
A histogram with a sum and quantile over a sliding window |
This allows a broad range of measurements like the count of requests or the avg latency between each of them and has to be figured out for each service or rather service landscape individually.
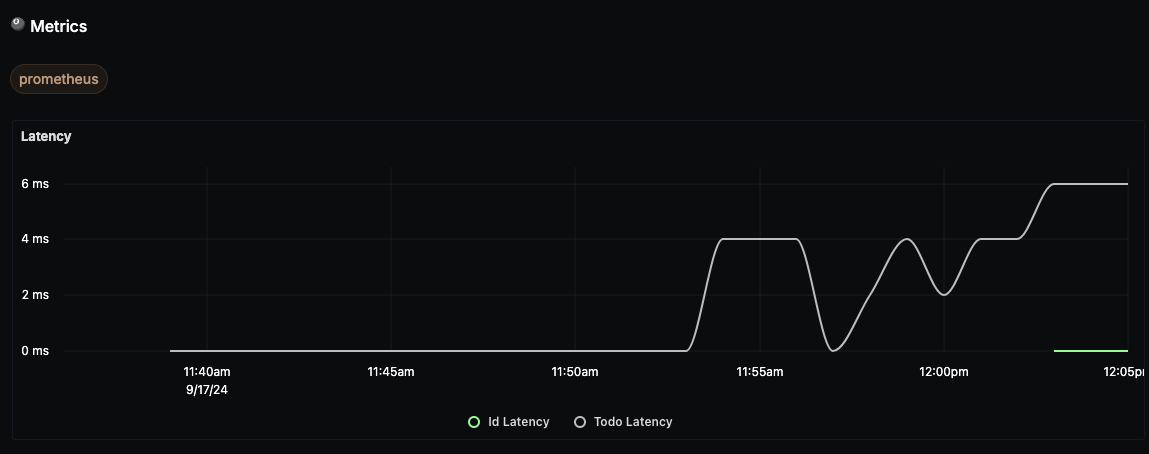
Still, when there are metrics they can be displayed on dashboards like this:
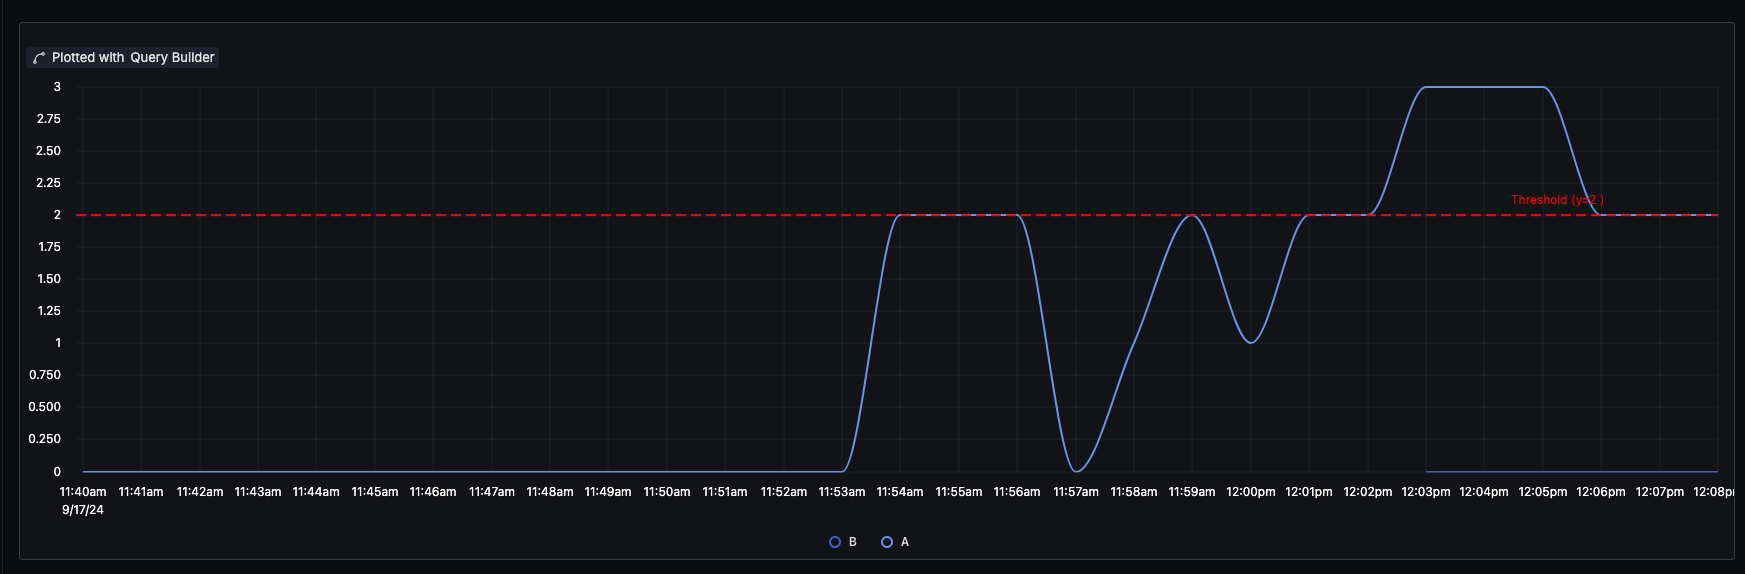
Alerts &
Although not directly related to the three pillars, alerts are a nice mechanic to define thresholds and intervals to receive notification over various kind of channels.
The documentation is as usual quite nice and there isn’t much to add here, besides the fact a paid subscription is required to connect SigNoz to teams. There is also a way to fallback to Power Automate, unfortunately this requires another subscription.
A little hack is to use connectors for Prometheus, but please consider supporting the good work of the folks of SigNoz:
Conclusion &
SigNoz is a great alternative to the established different solutions like EFK or Grafana in a well-rounded package. It is easy to install and so far as I can say easy to maintain and definitely worth a try.
All examples can be found here: